I love the chicago L trains, and wanted to pay my respect by building them a shrine in my house.
Update: Part 2
I saw a reddit post a long time ago where someone took a CTA map that is inside of the trains, and put colored lights where all the stops are. Heres a pic of what they made:
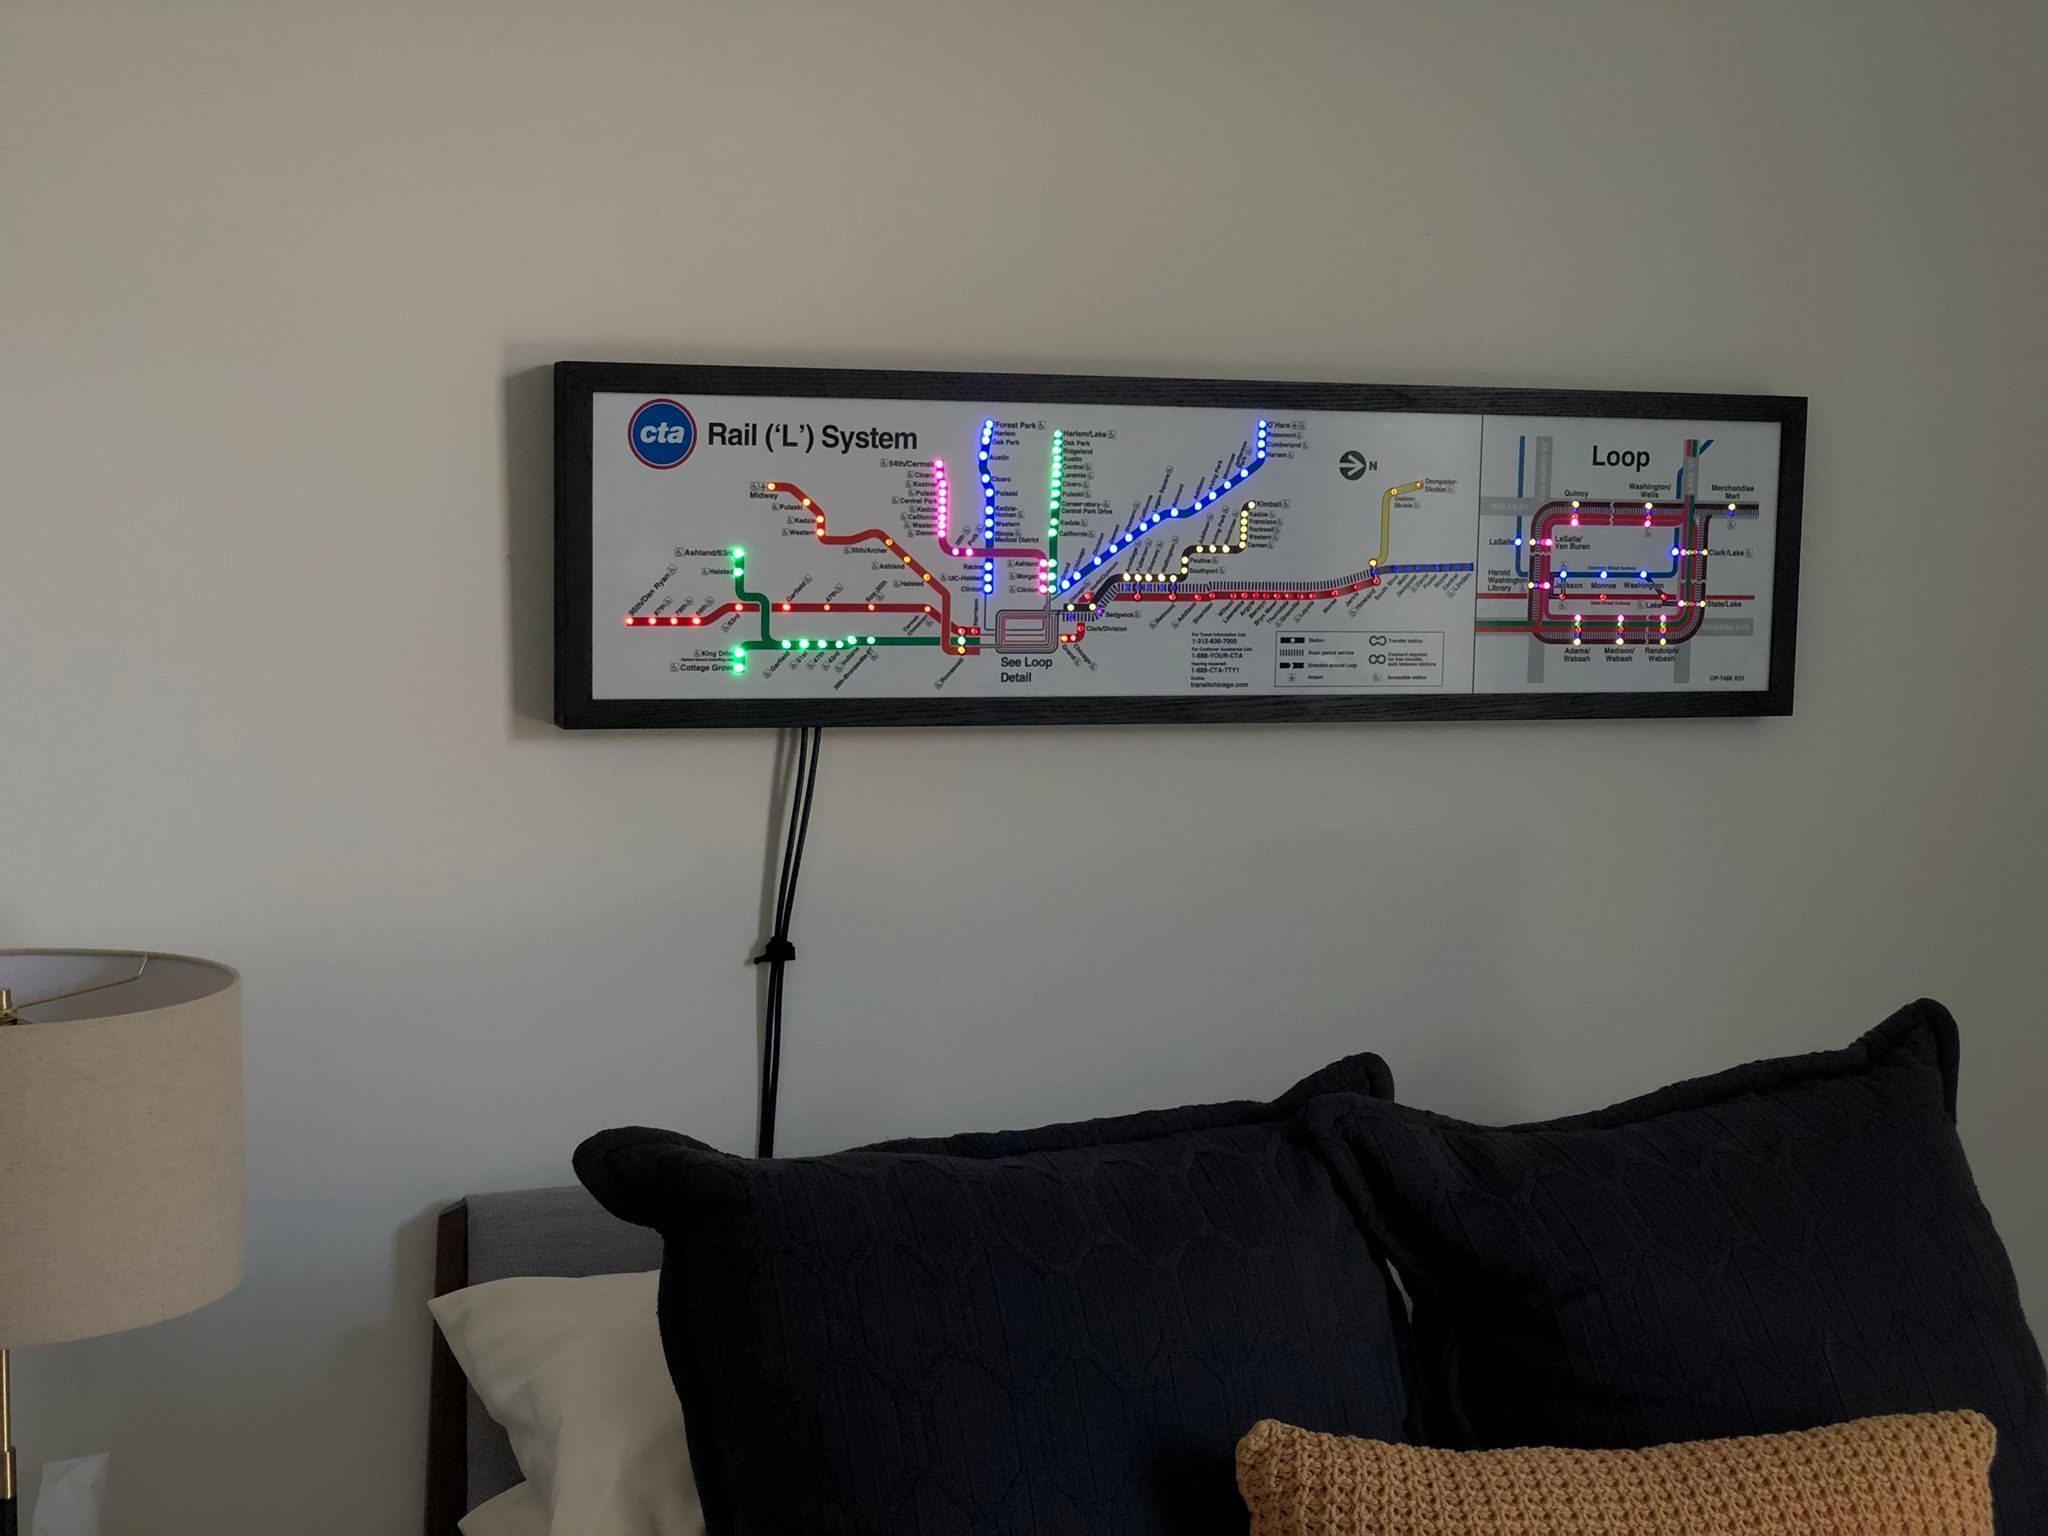
Pretty cool. They made the lights dimmable, and the lines are colored accordingly.
So lets take it one step farther. I like the idea, but I immediately thought..
What if you could see where the trains are right now?
It’s feeling like another raspberry pi project.
But honestly I have no idea how to control and power 200 individual leds from a raspberry pi. So that’ll be in part 2. In this part we’ll figure out how to see where the trains are at, and how to decide which leds to light up.
Software
A bit of code will be needed to first figure out where trains are, associate the stops to an individual led, and update the lights accordingly. Lets get started…
Also, I’m using javascript, because I want to.
(View the final site here)
The Map
I decided to make a simple digital map first so I can visualize what’s going on easier.
I did this with leaflet, which is a free map sdk for javascript.
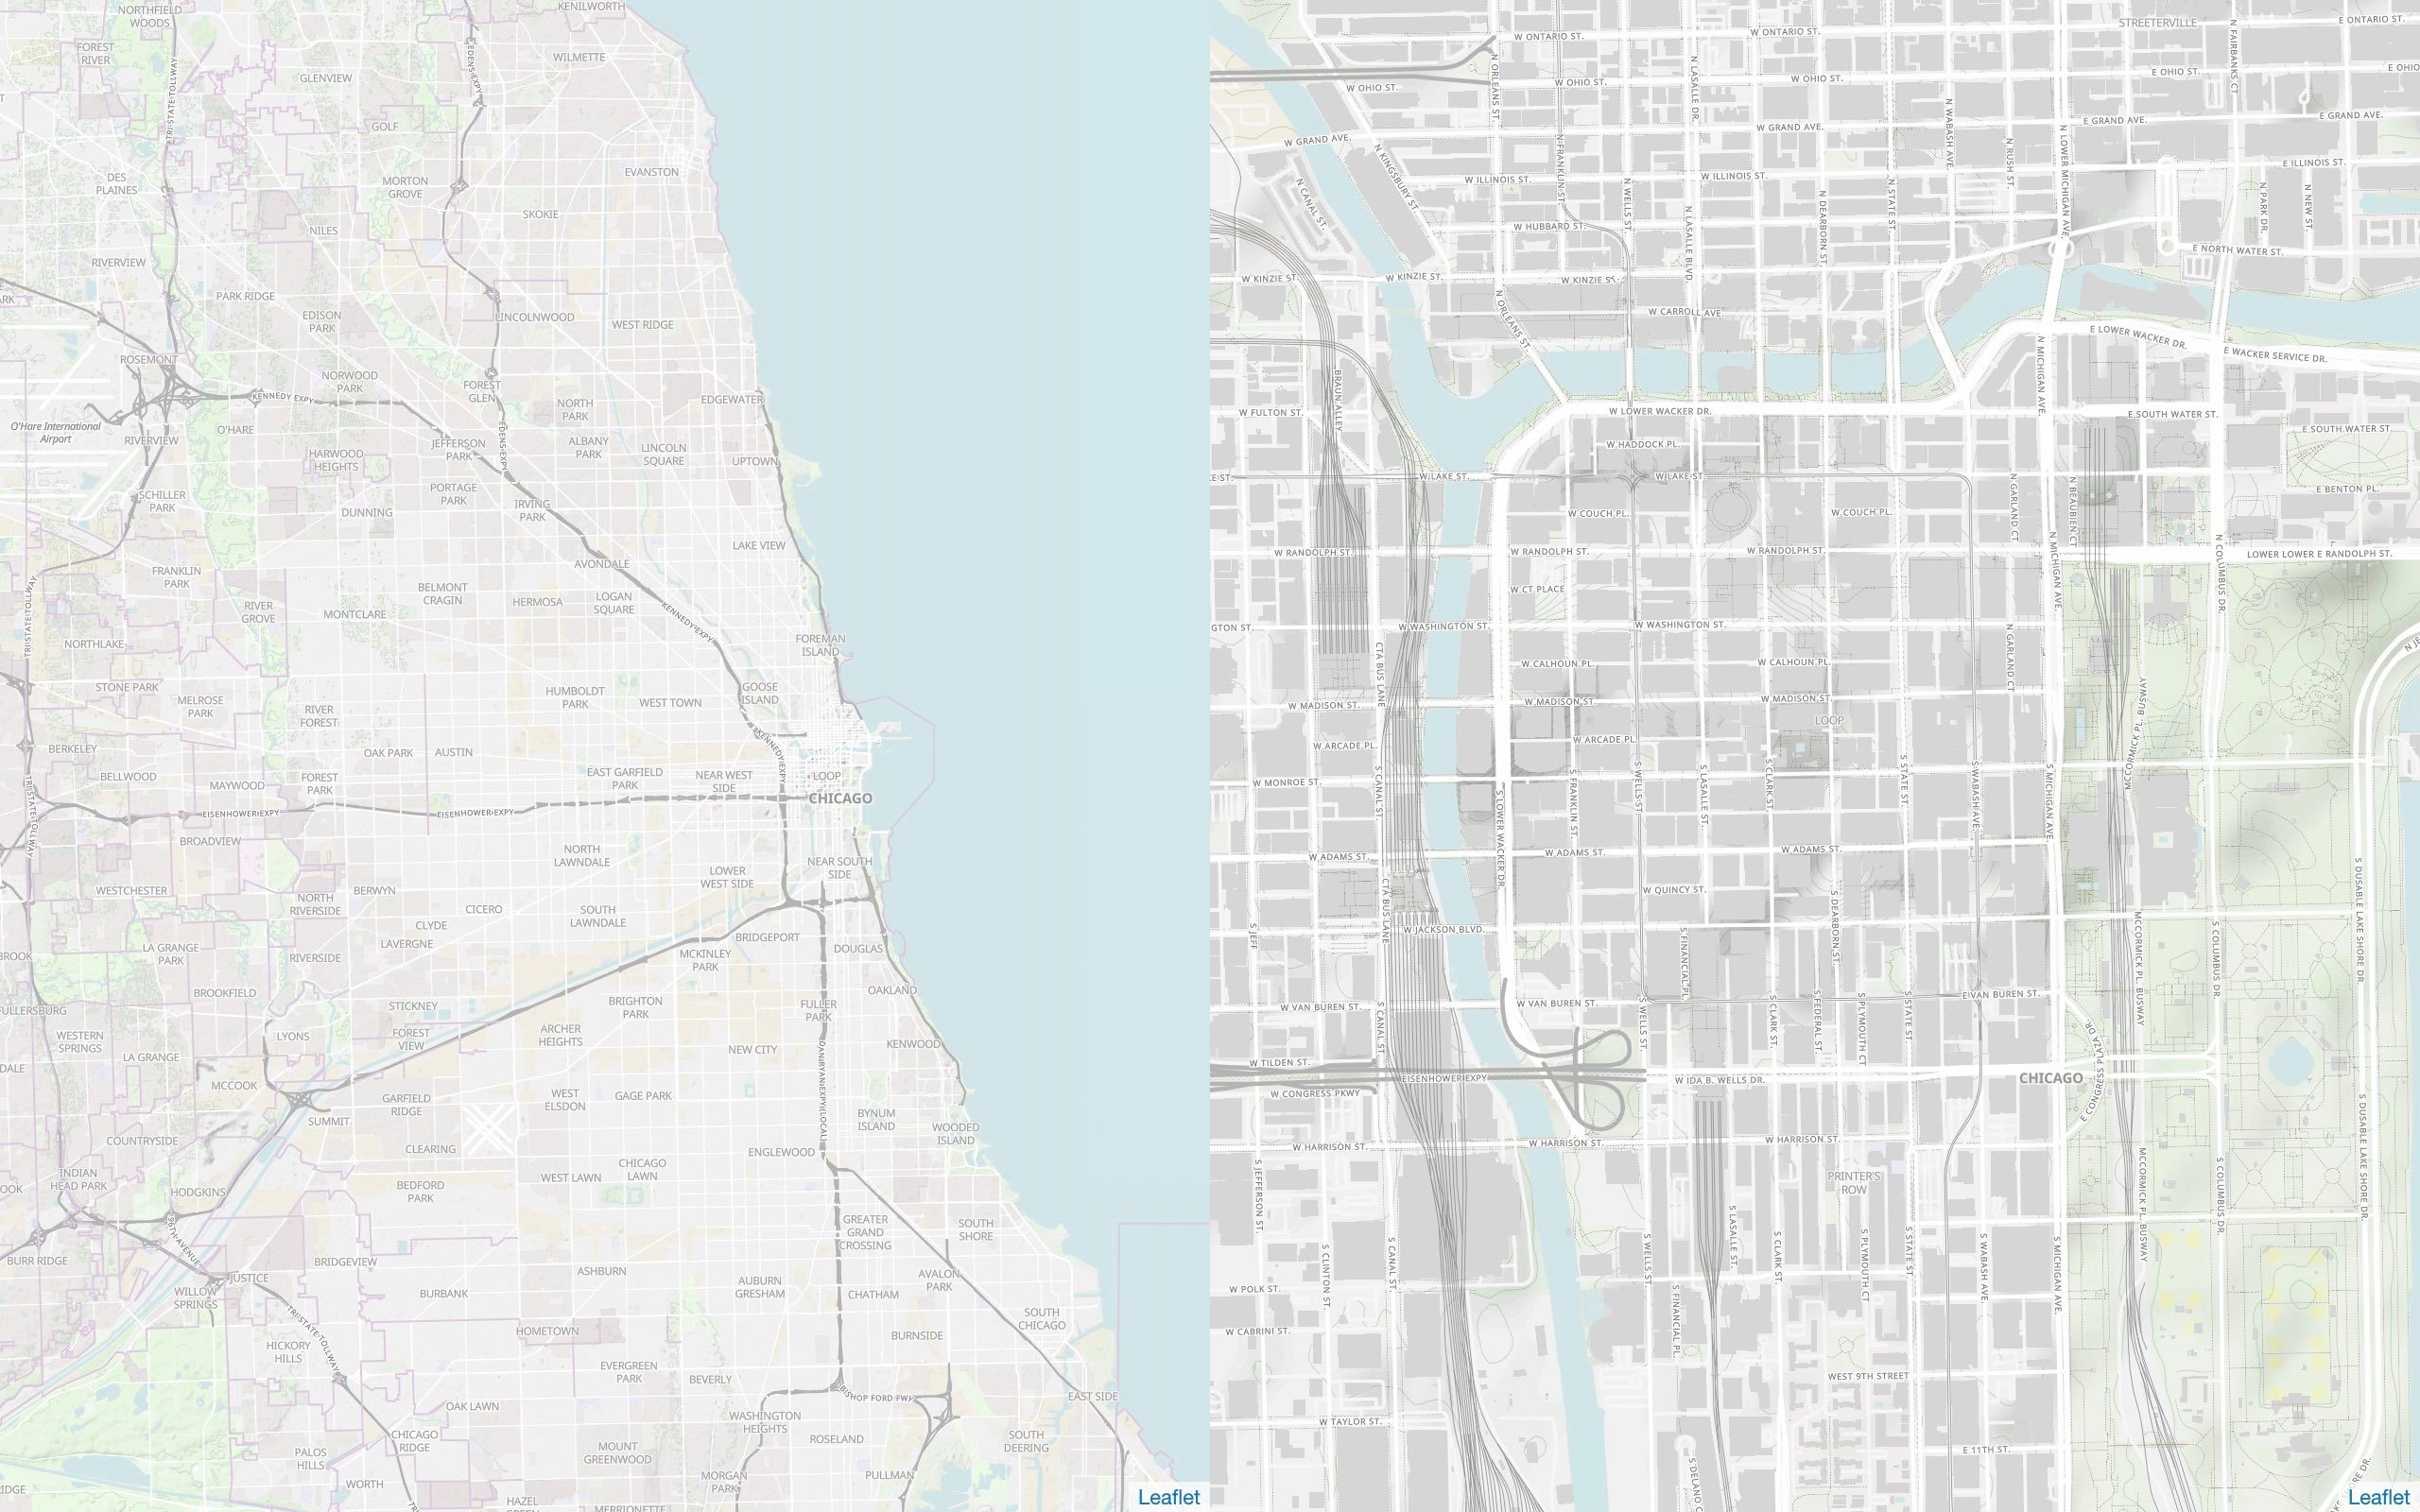
I’ll be making 2 maps, side by side, one for the larger network and one for the loop.
var map = L.map('mainmap', { zoomControl: false }).setView([41.8871, -87.7098], 11);
var loopmap = L.map('loopmap', { zoomControl: false }).setView([41.8810, -87.6298], 15);

L.tileLayer(MAP_TILE).addTo(map)
L.tileLayer(MAP_TILE).addTo(loopmap);
And thats chicago:
The CTA api
CTA is the chicago transit authority, and they control the trains in “L” metro, as well as all the bus lines in chicago.
Luckily they have an api, how nice! It’s made by the government though, so not so nice.
You can check it out here
But basically, they have 3 available datasets we can use: Arrivals, Follow This Train, and Locations.
After playing around with them all for a while, it seems Locations is what we need. It returns a list of all active trains, catorgorized by which line they are on, with some simple info on the train. Most notably, they include the next stop that the train will arrive at.
So a list of all trains, with the next stop their going to, sounds pretty perfect for deciding which leds to light up.
But not so fast! The actual data is way more confusing than that. Let me try to summarize the couple hours it took to figure this all out.
-
The datasets available are incomplete
list of stations and list of stops don’t include which line it’s talking about (needed to know which color led)
-
The “stop” is different than the “station”.
Let me try to explain: Trains going in different directions will have a different stop, but may be at the same station. Also, a single station may include many different colored lines.
Also, there’s the weird case of the purple line, which has the normal purple line (far north), and the purple express line (which goes all the way to the city center). These two lines overlap at some stations and will use the same LED, but are considered different colors by the api.
The data
FIrst I downloaded what data I could find on the CTA website. It was a single csv file that included all the stop, stations, and also every bus stop in one sheet. FYI, There are like ten thousand bus stops in chicago. Luckily I quickly figured out that train stops started with “30xxx”, while train stations started with “40xxx”. I seperated them into their own sheets, and converted them to JSON so now they look like this:
// STOPS:
[
 {
   "stop_id": 30001,
   "stop_code": "",
   "stop_name": "Austin-Blue",
   "stop_desc": "",
   "stop_lat": 41.870851,
   "stop_lon": -87.776812,
   "location_type": 0,
   "parent_station": 40010,
   "wheelchair_boarding": 0
 },
	...
]
// STATIONS:
[
{
"stop_id": 40010,
"stop_code": null,
"stop_name": "Austin (Blue)",
"stop_desc": "",
"stop_lat": 41.870851,
"stop_lon": -87.776812,
"location_type": 1,
"parent_station": null,
"wheelchair_boarding": 0
},
...
]For simplicity, I made my own list of lines:
// LINES:
[
  {
    "name": "RED",
    "route": "Red",
    "color": "#ff0000"
  },
	...
]
As you can see, there’s not too much info to work with here. In fact, the stops list was completely useless, as I couldn’t tell which color the stop was talking about. So I looked for more info, anywhere…
And found it, somehow. It was buried in what CTA had to give Google, so they could display the metro stops on Google maps. (Thank you, Google)
I found a list of stops that had some more info, namely which lines used the stop. Here what that looked like:
// STOPS:
[
 {
   "STOP_ID": 30186,
   "DIRECTION_ID": "S",
   "STOP_NAME": "Pulaski (Midway-bound)",
   "STATION_NAME": "Pulaski",
   "STATION_DESCRIPTIVE_NAME": "Pulaski (Orange Line)",
   "MAP_ID": 40960,
   "ADA": true,
   "RED": false,
   "BLUE": false,
   "G": false,
   "BRN": false,
   "P": false,
   "Pexp": false,
   "Y": false,
   "Pnk": false,
   "O": true,
   "Location": "(41.799756, -87.724493)"
 },
	...
]
So I threw out the original stop list I had and am using this one instead.
Do you see it? Hiding in there is a way to find every led light that is needed. I had to rub all 3 of my brain cells together pretty hard here.
All of the lights
So, knowing 2 pieces of info lets us find all of the colored stations that a train could be at.
We already know all of the stations. But some stations will need multiple lights, since multiple lines pass through them.
And now we know all of the stops, and which color lines use them!
The key is that the stops list also contain the station number in the MAP_ID field.
My method was to loop though every stop, and check
- which colors used the stop
- For each color at the stop, add the related station to a list, and keep track of all other stops that all used that station with the same color
The code looks like this:
// build a dictionary of all lines and the stations they use
// as well as the stops that use those stations

let dict = {};
for (let stop of stops) {
    let colors = getStopColors(stop); // array of all colors that use stop
    for(let color of colors) {
      if(stop.MAP_ID in dict[color]) {
        dict[color][stop.MAP_ID].stopIDs.push(stop.STOP_ID)
      } else {
        dict[color][stop.MAP_ID] = {
          station: getStation(stop.MAP_ID),
          line: getLine(color),
          color,
          stopIDs: [stop.STOP_ID]
        }
      }
    }
  }
So the getStopColors() function returns a list of all the line colors that use a stop.
Then, looping through those colors, I check to see if the stops’ station is already in the dictionary for that color.
if it is, I just add the stop_ID to the dictionary under that color and station.
If it’s not, I create the station under that color.
This results in a big dictionary which is organized by color line and station number.
To turn this into an list of all stations, I used this little piece of code here:
let all = [];
for(let color of Object.keys(dict)) {
  for (let mapID of Object.keys(dict[color])) {
    all.push({
      color,
      MAP_ID: mapID,
      stopIDs: dict[color][mapID].stopIDs,
      station: dict[color][mapID].station,
    })
  }
}
Now I have a list of all stations by color, along with the stops that use them.
Each one of the items in this list correlates to an LED on the map.
Also, when the api tells me which stop a train is at, using the stopIDS in this list, I can look up which led it is referring to and light it up.
The total number of LEDs I’ll need is: 190
As for individual colors:
RED: 33
BLUE: 33
BROWN: 27
GREEN: 30
ORANGE: 16
PURPLE: 26
PINK: 22
YELLOW: 3
Lets put these on a virtual map to see what they look like.
Mapping the L
I’ll just loop through all the stations and put them on a map. This is pretty easy since our station dataset provides the latitude and longitude of each station.
I’ll also color them.
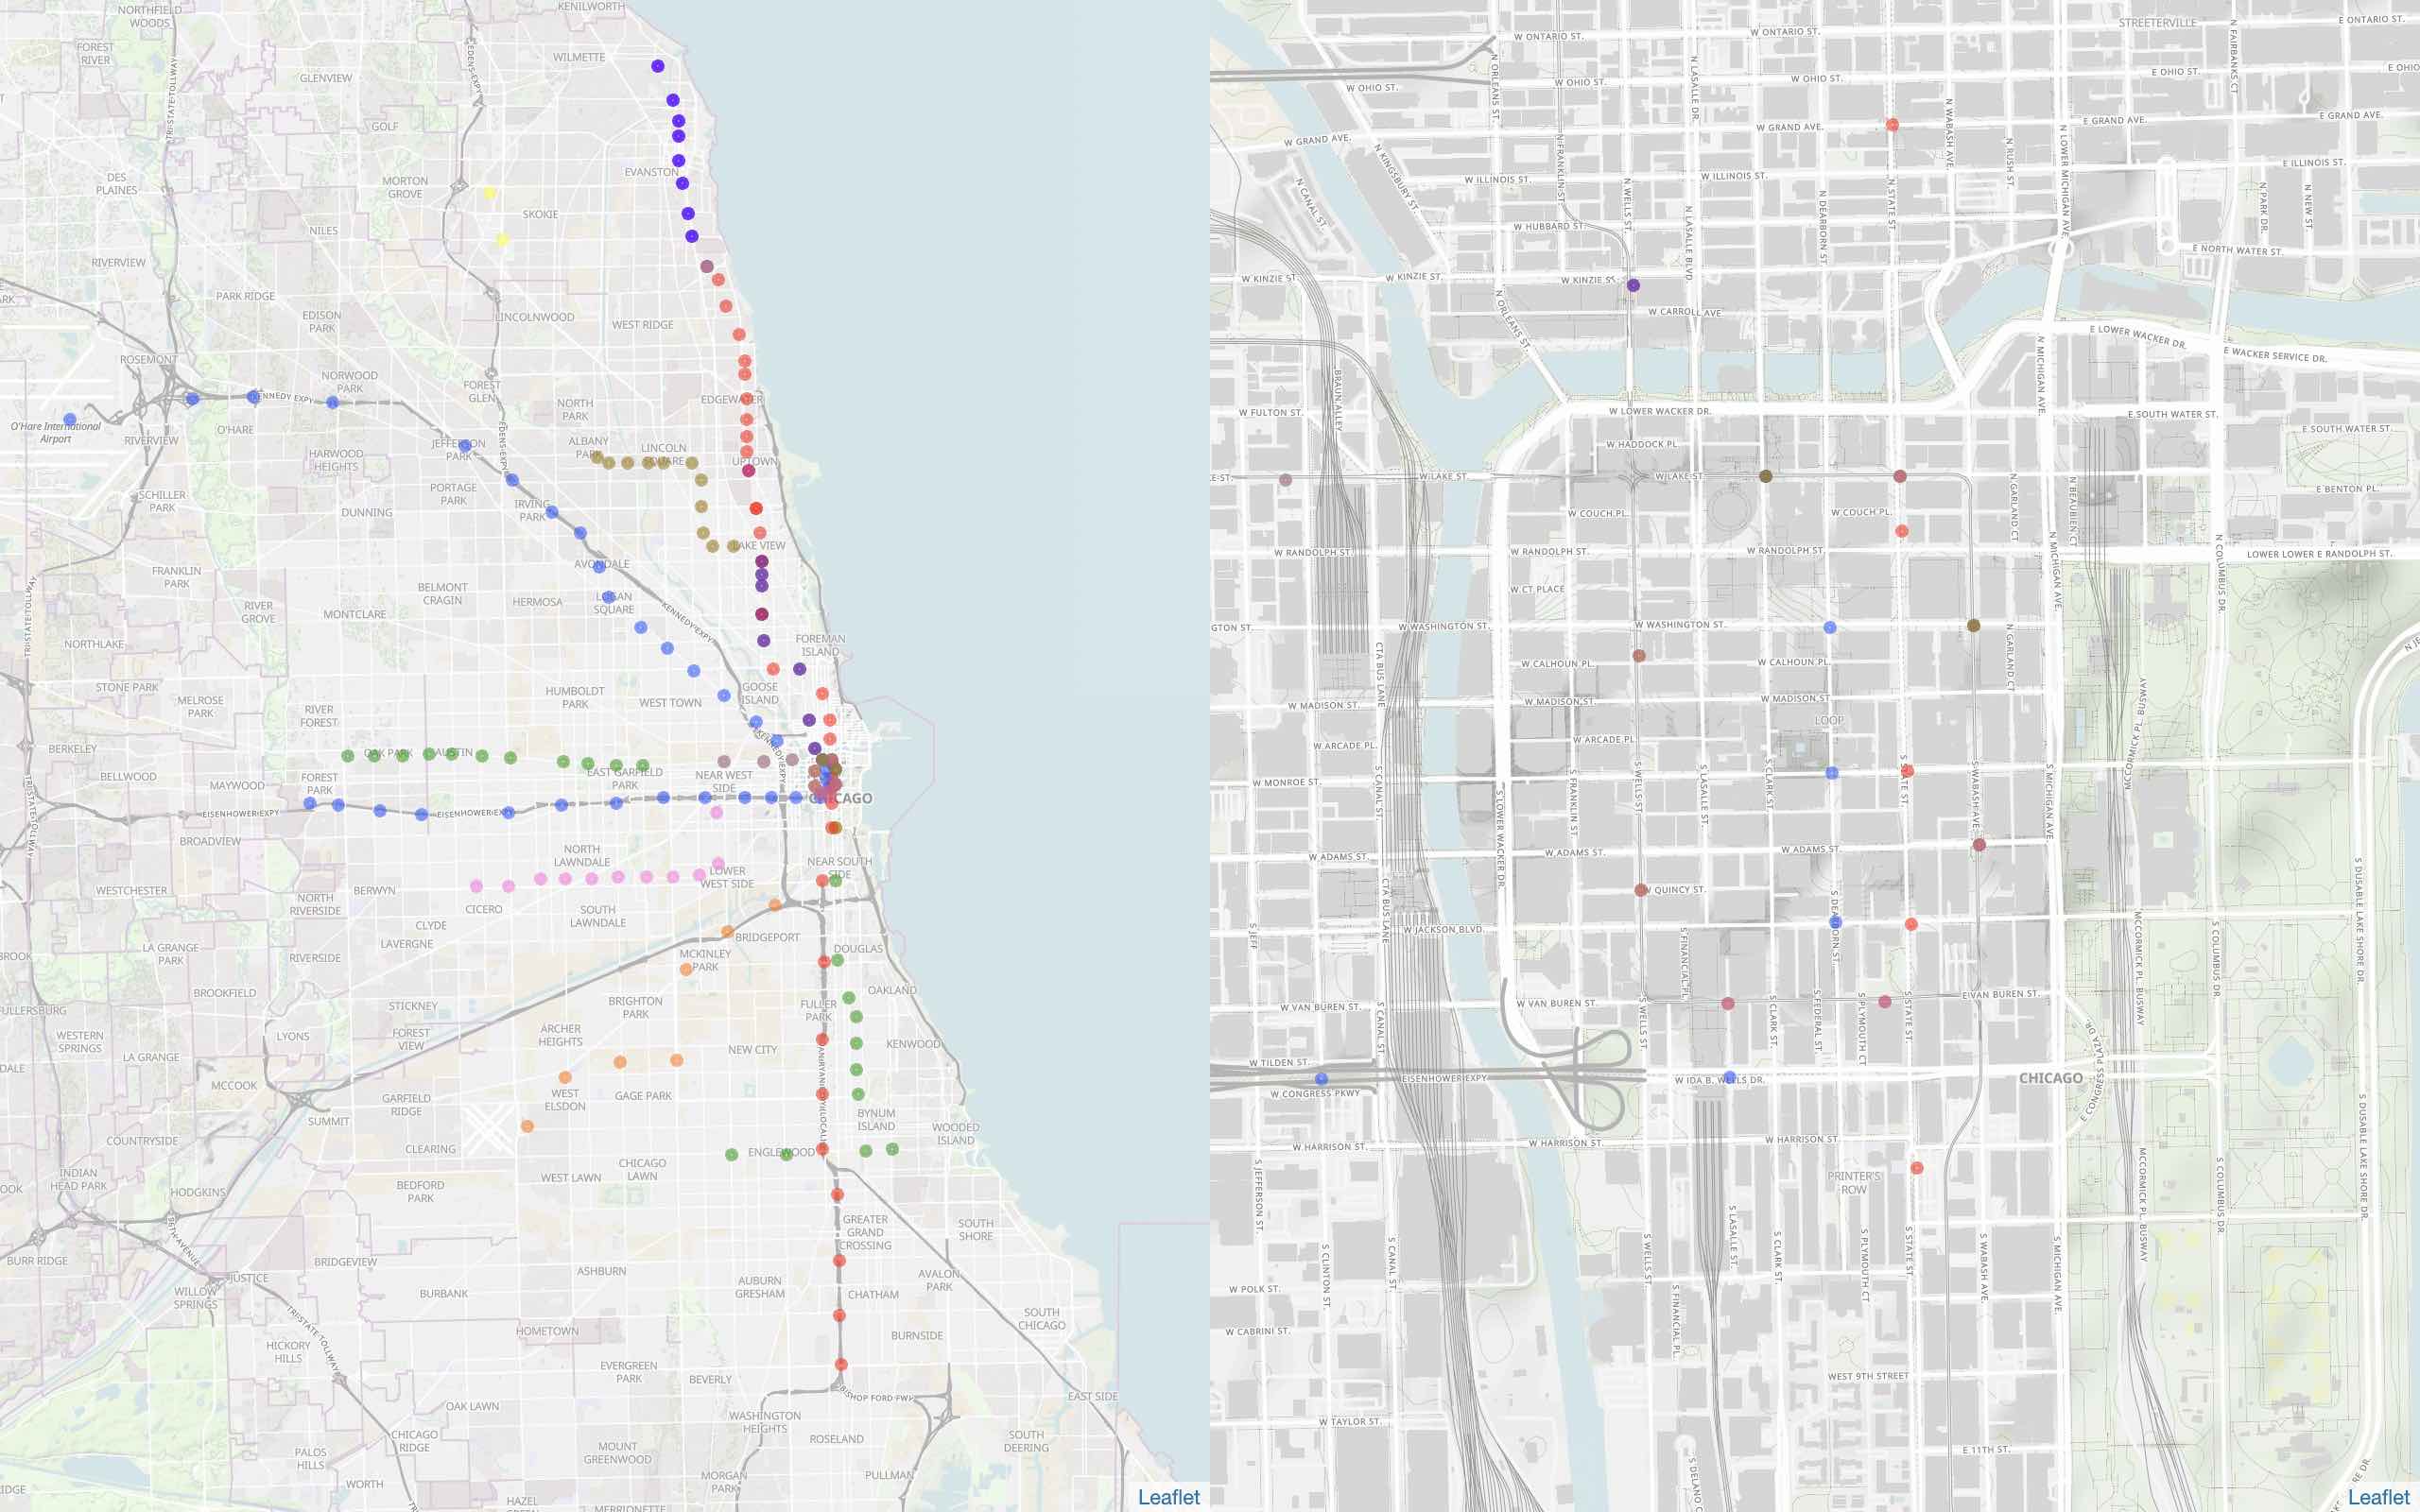
Hmm, that actually looks right. Each dot on here represents a LED. They are overlapping, but I won’t worry about that for now.
Adding the trains
Next i’ll make a request to the CTA api and turn the relevant LEDs “on” (virtually for now).
The request returns a weirdly formatted jumble of data sorted by color. After sifting through the datatypes, I got a list of trains, their color, and which stop they are at.
Since we made such a nice station list earlier, I can easily look up the relevant LED dot by color and stop, and turn it on.
The resulting map is pretty cool:
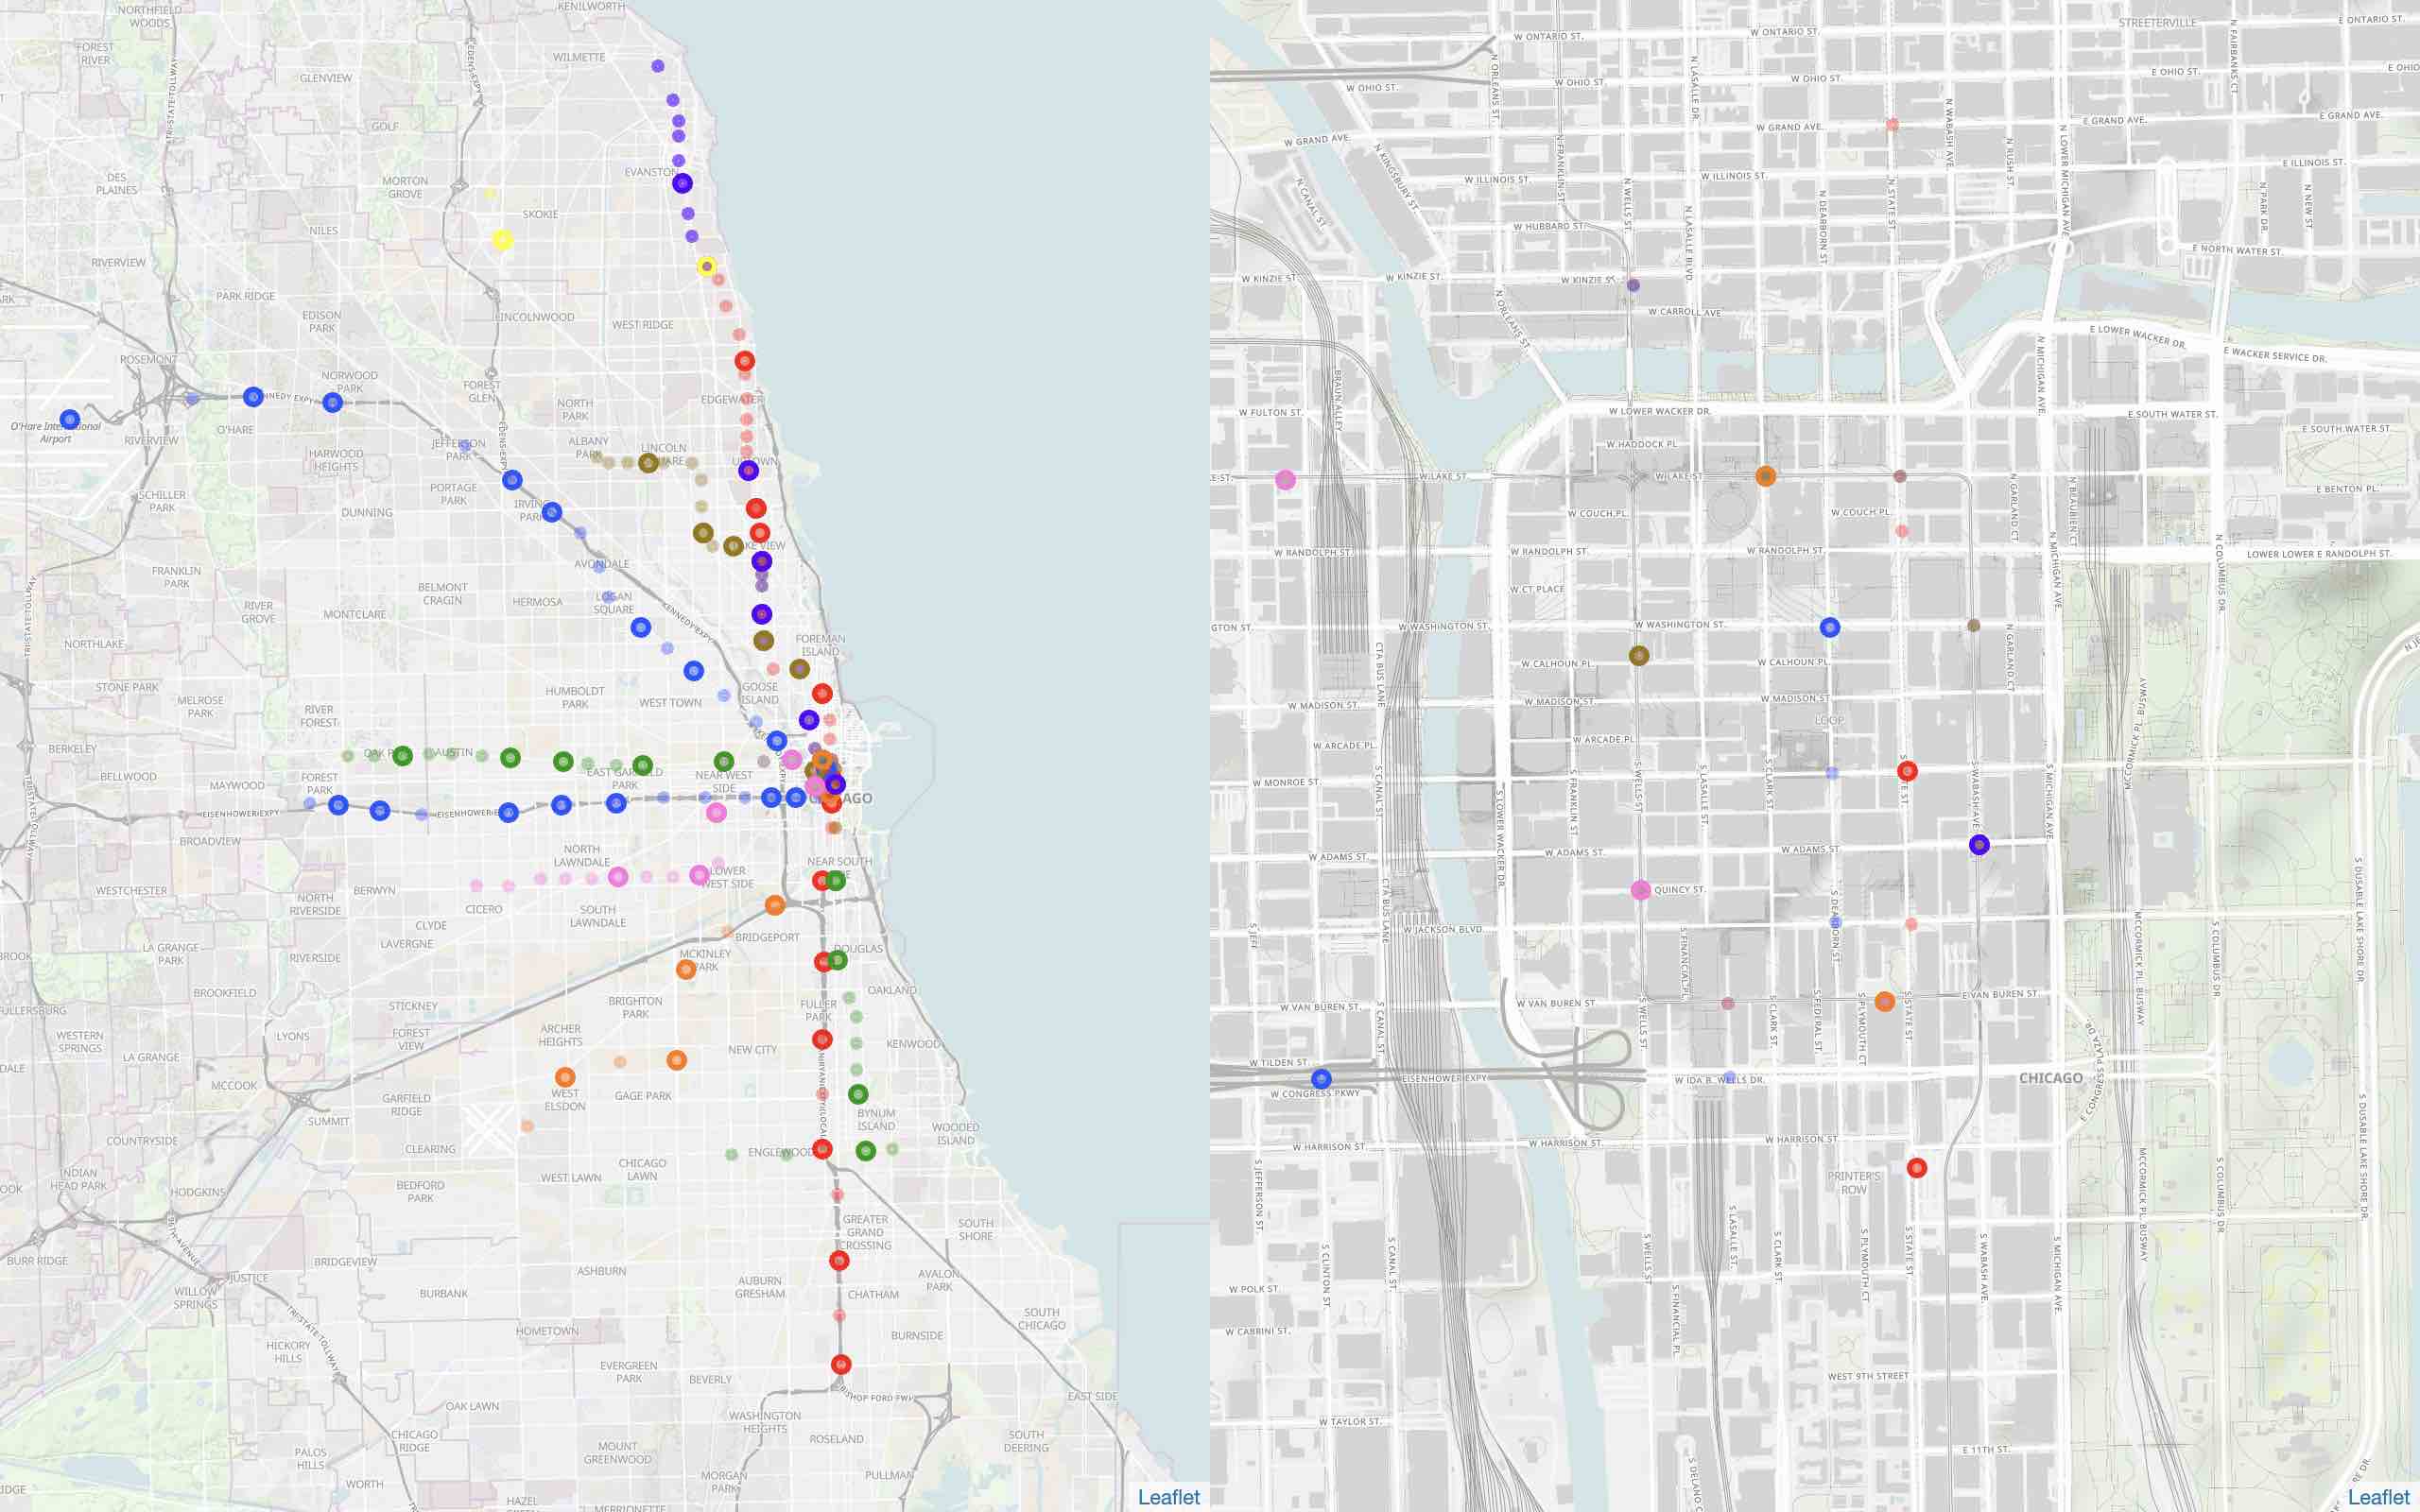
These are real time locations of the trains in chicago! There’s quite a few of them scurrying about. By adding a poll, it’ll update the positions regularly.
Something interesting I noticed during this project is that all the lines shut off during the night except the red and blue lines. Neat.
View the site here
Wrapping up
The important note for why all this code was needed - we aren’t just plotting locations, but have broken down positions into a simple list of 190 points that will be either off or on.
You can see on the map the “lights” and how they will be on or off to show where the trains are.
This about does it for the code part. Join me next time to see how to actually wire and light all of these up using a raspberry pi.
Read Part 2 to see how the map works.